Our Performance
Performance of our TSP Allocation Service
2026 Performance (Updated: 07/10/26): Our year-to-date return stands at +9.57%, outperforming the buy-and-hold benchmark's gain of +9.13% and substantially exceeding the G Fund's return of +2.30%. These results are particularly impressive given the extreme volatility, rapid market reversals, and heightened uncertainty that have characterized 2026. While many investors have struggled to navigate this turbulent environment, our disciplined, rules-based approach has enabled us to preserve capital, manage risk, and continue generating competitive returns.
Yearly Returns (2005-2025): Since its inception in 2005, our TSP Allocation Service has achieved an average annual return of +13.23% across multiple bull and bear market cycles. Over the same period, a traditional buy-and-hold approach has generated an average annual return of +7.48%, while the G Fund has returned an average of +2.90% per year. As a result, our strategy has historically delivered nearly twice the long-term performance of the buy-and-hold approach while providing active guidance through a wide range of market environments.
A sustained +13.23% average annual return over more than two decades represents an exceptional long-term performance record compared to that achieved by most individual investors and many professional money managers. Based on our ongoing review of competing services, we believe TSPFundTrading.com possesses the strongest long-term track record among all TSP market timing services. Our results reflect more than 21 years of disciplined investment management through a wide variety of market environments, including both bull and bear markets. Our results speaks for themselves.
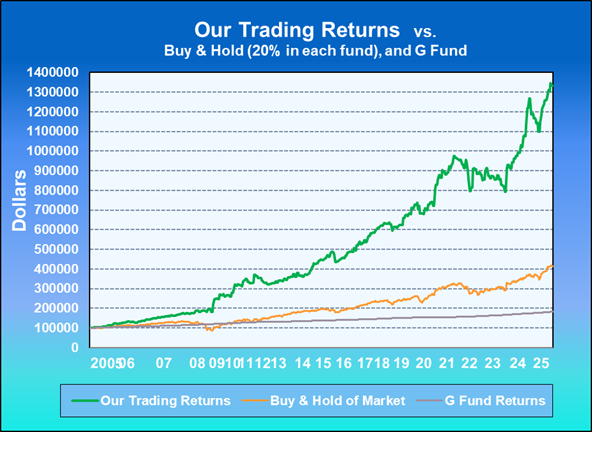
Compounded Returns: Since the inception of our service on January 1, 2005, through the end of 2025, an initial investment of $100,000 would have grown to $1,333,354 based on our real-time trading returns. Over the same period, the traditional buy-and-hold approach would have grown to $414,382, while the G Fund would have increased to $182,975. These figures illustrate the remarkable long-term power of compounding and do not include any additional contributions that members may have made during the 21-year period.
Join today and receive our current fund allocation recommendations along with our in-depth weekly newsletter featuring market analysis, technical indicators, and investment commentary.

Special Note: Access to the Members page with the latest IFT distribution allotments are provided to Members only.
| Our performance returns are independently verified by TimerTrac. |  |
How the TSP Calculates Share Price: The value of your TSP account is determined each business day based on the daily share price and the number of shares you hold in each fund. At the end of each business day, after the stock and bond markets have closed, the total value of the funds' holdings (net of accrued administrative expenses) is divided by the total number of shares outstanding to determine the share price for that day.
Our main goal is to maximize our TSP savings during bull market cycles and protect capital during potentially unstable market periods.
In addition to using technical and fundamental analysis, we are now validating our interpretation by using a mechanical impulse system. The impulse system uses a combination of trend following and momentum, which maximizes gains when the market is trending.
Compounding Our Performance vs. Buy-and-Hold
| Year | Buy & Hold Trades with 20% in each Fund (%) | Buy & Hold Compounded Returns starting with $100,000 | Our Cumulative Year-To-Date Returns (%) | Our Compounded Returns starting with $100,000 |
|---|---|---|---|---|
| 2025 | 14.66 | 414,382.63 | 13.01 | 1,333,354.04 |
| 2024 | 10.38 | 362,219.89 | 25.49 | 1,189,054.78 |
| 2023 | 15.94 | 328182.44 | 10.12 | 931023.94 |
| 2022 | -13.64 | 282556.67 | -9.66 | 854305.96 |
| 2021 | 10.50 | 327200.13 | 11.38 | 954186.67 |
| 2020 | 13.36 | 296707.67 | 17.18 | 854688.59 |
| 2019 | 17.16 | 261224.77 | 20.51 | 728662.92 |
| 2018 | -4.65 | 220775.18 | 2.26 | 595915.47 |
| 2017 | 13.28 | 231824.21 | 16.84 | 583970.65 |
| 2016 | 7.34 | 203255.30 | 6.73 | 495310.40 |
| 2015 | 0.34 | 189449.48 | 10.39 | 475272.01 |
| 2014 | 5.51 | 189287.41 | 14.69 | 429459.90 |
| 2013 | 16.48 | 179481.27 | 15.42 | 372873.43 |
| 2012 | 12.10 | 152592.67 | -2.15 | 320719.82 |
| 2011 | 2.11 | 136019.12 | 5.54 | 330597.13 |
| 2010 | 14.03 | 135068.28 | 15.63 | 314428.30 |
| 2009 | 25.47 | 120290.54 | 36.87 | 271436.21 |
| 2008 | -30.79 | 94221.93 | 10.59 | 194028.56 |
| 2007 | 7.01 | 130818.61 | 16.27 | 175308.19 |
| 2006 | 12.70 | 122184.92 | 21.47 | 149330.70 |
| 2005 | 7.70 | 107852.04 | 19.24 | 120968.82 |
If your current trading style is not making these returns, we encourage you to Join Now and become part of our growing number of federal government employees & military personnel who are prospering from our valuable service!
Graphical Representations of our Overall Performance:
Growth of TSP Savings
Performance Line Chart
Performance Bar Chart


|